
New data released by census.gov show a West Hollywood in flux, with nonwhite populations growing, wealth disparity deepening and a workforce evolving.
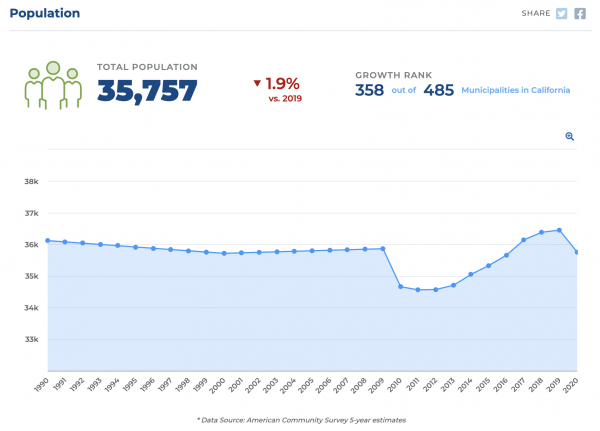
WeHo lost 2.5 percent of its population from 2020 to 2021 —about 896 people.
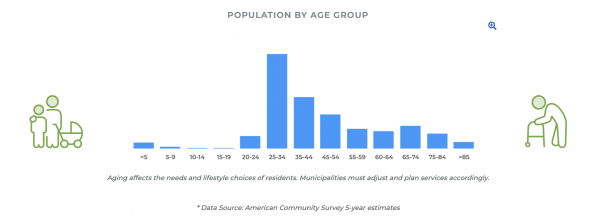
Less than 4 percent of WeHo residents are under 18 years old, and only 45 percent are female. White people still dominate the landscape at more than 70 percent. Hispanics come in at second at 14 percent, with mixed race residents following closely behind at more than 8 percent — begging the question, why don’t we have a Hispanic/Latino/Spanish-language Advisory Board?
Nearly a quarter of residents are foreign-born, and nearly a third speak a language other than English at home.
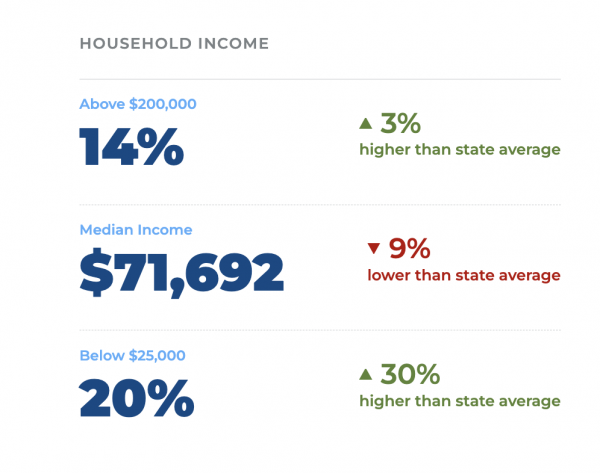
WeHo residents are on average very educated and almost all have access to the internet. Nearly 60 percent have a college degree — but about 12 percent live below the poverty line.
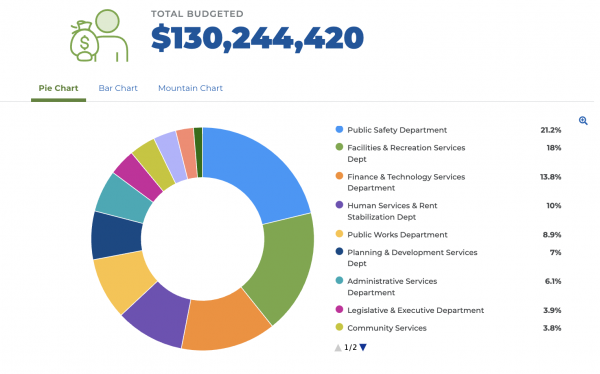
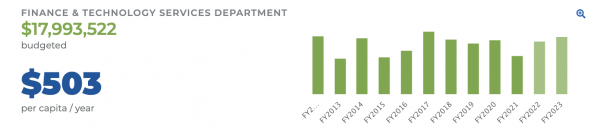
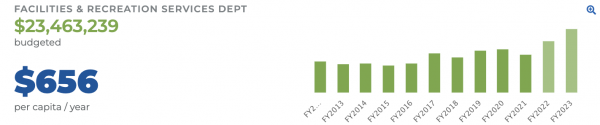
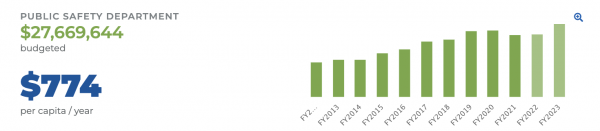
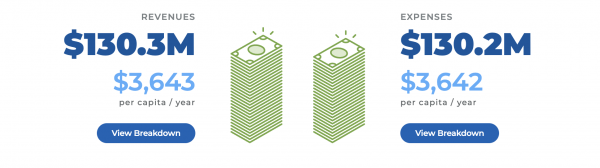
Another set of data from cleargov.com delves into WeHo’s finances, which confirms just how much the city is spending on public safety.
| POPULATION ESTIMATES ●●●●●●●●●●●●●●●● | |
| Population Estimates, July 1 2021, (V2021) | 34,938 |
| Population estimates base, April 1, 2020, (V2021) | 35,848 |
| Population, percent change – April 1, 2020 (estimates base) to July 1, 2021, (V2021) | -2.50% |
| Population, Census, April 1, 2020 | 35,757 |
| Population, Census, April 1, 2010 | 34,399 |
| AGE AND SEX ●●●●●●●●●●●●●●●● | |
| Persons under 5 years, percent | 2.30% |
| Persons under 18 years, percent | 3.90% |
| Persons 65 years and over, percent | 15.80% |
| Female persons, percent | 45.10% |
| RACE AND HISPANIC ORIGIN ●●●●●●●●●●●●●●●● | |
| White alone, percent | 77.30% |
| Black or African American alone, percent(a) | 3.60% |
| American Indian and Alaska Native alone, percent(a) | 0.40% |
| Asian alone, percent(a) | 6.20% |
| Native Hawaiian and Other Pacific Islander alone, percent(a) | 0.10% |
| Two or More Races, percent | 8.10% |
| Hispanic or Latino, percent(b) | 13.40% |
| White alone, not Hispanic or Latino, percent | 71.30% |
| POPULATION CHARACTERISTICS ●●●●●●●●●●●●●●●● | |
| Veterans, 2016-2020 | 902 |
| Foreign born persons, percent, 2016-2020 | 24.60% |
| HOUSING ●●●●●●●●●●●●●●●● | |
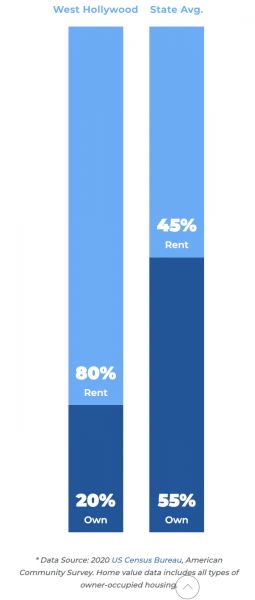
| Owner-occupied housing unit rate, 2016-2020 | 19.80% |
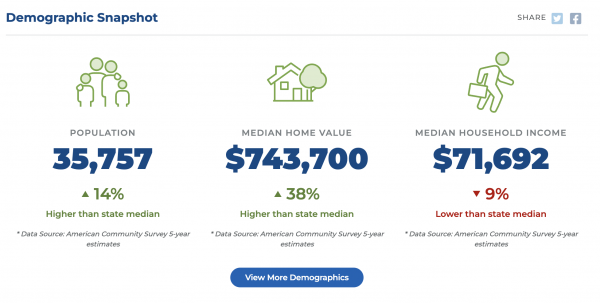
| Median value of owner-occupied housing units, 2016-2020 | $743,700 |
| Median selected monthly owner costs -with a mortgage, 2016-2020 | $3,179 |
| Median selected monthly owner costs -without a mortgage, 2016-2020 | $962 |
| Median gross rent, 2016-2020 | $1,744 |
| FAMILIES AND LIVING ARRANGEMENTS ●●●●●●●●●●●●●●●● | |
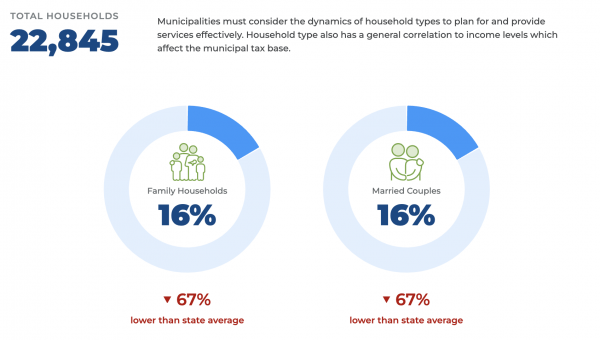
| Households, 2016-2020 | 22,845 |
| Persons per household, 2016-2020 | 1.55 |
| Living in same house 1 year ago, percent of persons age 1 year+, 2016-2020 | 84.90% |
| Language other than English spoken at home, percent of persons age 5 years+, 2016-2020 | 27.20% |
| COMPUTER AND INTERNET USE ●●●●●●●●●●●●●●●● | |
| Households with a computer, percent, 2016-2020 | 94.30% |
| Households with a broadband Internet subscription, percent, 2016-2020 | 90.00% |
| EDUCATION ●●●●●●●●●●●●●●●● | |
| High school graduate or higher, percent of persons age 25 years+, 2016-2020 | 96.60% |
| Bachelor’s degree or higher, percent of persons age 25 years+, 2016-2020 | 60.10% |
| HEALTH ●●●●●●●●●●●●●●●● | |
| With a disability, under age 65 years, percent, 2016-2020 | 6.70% |
| Persons without health insurance, under age 65 years, percent | 6.10% |
| ECONOMY ●●●●●●●●●●●●●●●● | |
| In civilian labor force, total, percent of population age 16 years+, 2016-2020 | 79.30% |
| In civilian labor force, female, percent of population age 16 years+, 2016-2020 | 75.40% |
| Total accommodation and food services sales, 2017 ($1,000)(c) | 968,345 |
| Total health care and social assistance receipts/revenue, 2017 ($1,000)(c) | 3,599,418 |
| Total transportation and warehousing receipts/revenue, 2017 ($1,000)(c) | 3,788 |
| Total retail sales, 2017 ($1,000)(c) | 1,424,383 |
| Total retail sales per capita, 2017(c) | $39,904 |
| TRANSPORTATION ●●●●●●●●●●●●●●●● | |
| Mean travel time to work (minutes), workers age 16 years+, 2016-2020 | 29.4 |
| INCOME AND POVERTY ●●●●●●●●●●●●●●●● | |
| Median household income (in 2020 dollars), 2016-2020 | $71,692 |
| Per capita income in past 12 months (in 2020 dollars), 2016-2020 | $69,589 |
| Persons in poverty, percent | 11.60% |
| All employer firms, Reference year 2017 | 3,018 |
| Men-owned employer firms, Reference year 2017 | 1,889 |
| Women-owned employer firms, Reference year 2017 | 644 |
| Minority-owned employer firms, Reference year 2017 | 451 |
| Nonminority-owned employer firms, Reference year 2017 | 2,313 |
| Nonveteran-owned employer firms, Reference year 2017 | 2,694 |
| GEOGRAPHY ●●●●●●●●●●●●●●●● | |
| Population per square mile, 2020 | 18,939.10 |
| Population per square mile, 2010 | 18,225.60 |
| Land area in square miles, 2020 | 1.89 |
| Land area in square miles, 2010 | 1.89 |
It seems pretty simple to me. Number one, this city has become unaffordable. Number two, they are tearing down multiunit dwellings, and replacing them with these mini mansion things. It has happened up and down my street. So the wealthier can move in, and the less wealthy have to move. And this decreases the housing stock, allowing both of those things to take place at once. Covid forced a lot of people out of the city. They just couldn’t afford it anymore. Especially with losing their jobs. I have a friends who were even well to do, and they move… Read more »
I agree whole heartedly. Why don’t we have a Latino/a advisory board? With a population size much larger than our Russian neighbors, there needs to be better services for our Latino/a community members.
WeHo was founded on the principle of being a Gay Mecca. NOT so much anymore! People are fleeing to other neighborhoods. Rents are out of control. There needs to be a moratorium on rent increases for 3-5 years! Massive amounts of vacant commercial space. Small businesses cannot afford the high rents. WeHo is now just a place for out-of-city folks to come to get drunk and cause damage.
The fact that 80 percent of people living in WH rent, speaks volumes.
WeHo has changed considerably. For. The. Absolute. Worst.
Yup. With the current council it sure has.
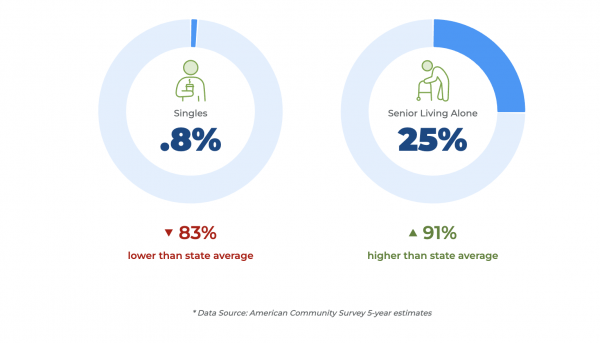
Wait, the percentage of single people living alone is… 0.8%? There are literally like 25 single non-seniors living in West Hollywood? Um, is that the correct number from the Census Bureau or is that an error somewhere else? Not that I believe the percentage is all that much higher than this, but 0.8%? If it is true, then than, too, is a tragedy: we have priced youth out of the market, and are left with an old folks home no one can afford.
If our population is down and the number of residential units we have constructed since that last census is up, who is in all those “vacant” units? It would appear that the City’s efforts to build housing are being off set by that lack of enforcement of Air BnB and “extended stay” facilities. When housing costs are through the roof, this is not a situation we should tolerate.
As someone running for city council, do you support vacancy taxes both in residential and in commercial property to help curtail chronic vacancies and help make rents more affordable?
As I said at the recent Council meeting, I thought the idea had merit but unless the majority of the City Council was actually going to campaign for it, it would not have a chance of passage.
The Council voted not to put the measure on the ballot. I also think that we don’t have good numbers on the residential vacancy rates as there are a large number of Air BnB or the like that are simply not being reported as the City is not being aggressive in locating these units.
Do not kid yourself with BS and these statistics.
Hundreds of thousands of gay people can not stand Weho and would never live here or go out here. That’s a fact of life. No matter what race they are or where they come from.
And if anyone does not know or admitted it, you have been living under a rock for the last 30 years.
There are many young gay men who can no longer afford to live in WeHo as when I was a Baby Boomer college student. At the same time, there are more crowded gay bars in WeHo than ever. It has always been a popular sport to “Hate West Hollywood Queens,” yet the Millennials have little problem coming to our gay bars just like in the good old days when young gay males constituted a larger percent of the population who rented apartments in WeHo.
This is an odd dissonance – the demographic data reflects by a large the editorial stance Wehoville has had under Larry (pro-policing, anti-increased housing density) but it seems like you somehow want to paint this mutli-year trend as a result of the current administration, which has been in place for, what, two years? More old, rich, white people is the exact outcome of what Lauren Meister is advocating through her policies. The only sizable workforce housing on tap in the entire city has been roundly and aggressively attacked on this site. You are literally getting the city you want… and… Read more »
Why not? Sounds like you blame me for the census and I didn’t even read the story, just arrived back from out of town.
Seriously?? Sepi has only been in office 20 months, hardly enough time to have impacted the housing situation in any meaningful way. West Hollywood’s inclusionary housing is way more demanding and effective than surrounding communities and if you look at the numbers, we have been successful in allowing thousands of long term tenants from being force out of our city. The numbers don’t lie but I suppose you can manipulate them if you can find a gullible audience.
The poverty level in our little town is shocking, meanwhile our electeds are trading service contracts, management salaries and endless favors for the political class & glitterati
With 94% of the citizens wired to the internet, you’ d think that the city leaders would provide free Wi-Fi for all the residents. After all, they spent nearly $40,000 per resident on the new park. There’s not even a band shell.
People would complain about free wi-fi attracting homeless people.
I recall reading years ago how an outdoor performing arts facility for a corner of the park was offered to the city as donation. What happened to that?
New park improvements and adjacent recreation center was about $110,000,000 / 35,000 people is about $3,200 per person.
Great article. I like seeing a growth in ethnic minorities. Not growth in the wealthier.
Hispanic/Latino/Spanish-language Advisory Board is a great idea. Or maybe an Ethnic Minority Advisory Board?
You missed a key point. A couple of weeks ago I engaged with some white supremacists on this site one of which, for instance, suggested that racial discrimination against Blacks in WeHo was due to the fact that Blacks are not “charming” enough to avoid discrimination. Almost to a one, this vast number of commentators denied being in any way racist. Things fell apart when I compared the percentage of Blacks living west of to to number living east of La Brea. The number I used then, 3.9 percent of Blacks in WeHo, has reduced, now doubt through self segregation,… Read more »
Ryan: where is it you are now living that is so superior? Btw, that term you used, ‘tamale hombres’, as you call them, some consider a racist and highly offensive generalization.
I will begin by saying that you just, quite literally, proved my point. WeHo is overwhelmingly populated by White fools who know little about other cultures and make all other cultures squeamish about even visiting, let alone living among you. A Tamale Hombre walks the streets and with alarge container and sells tamales to the folks and workers in the neighborhood. There’s one who I see virtually every single day. A really, super nice guy with a huge smile. But you live in WeHo, where the only Tamale Hombres are dancing at a bar, but have to live in East… Read more »
Stay in your lane whitey
Your comment is meaningless. Magic Johnson is a black millionaire as was Quincy Jones. Neither moved to Compton when they racked up coins. They moved to upscale, predominately white communities. It’s not a matter of discrimination but where you want to live and can afford. To live.